Powerful FAANGs
I hope you’re getting back to some sense of “normal” after a crazy week or so due to the Kincade Fire. For me, it’s good to be back home and back in the office. I hope you and yours did okay, all things considered.
This week I wanted to address a question posed to me by a client about skipping the “broad market” and simply investing in the so-called FAANG stocks (the acronym is explained later). While it might sound like an interesting idea because the big tech names have been performing well lately, casting aside a diversified portfolio for a handful of stocks is probably a bad idea.
However, if you had a functional crystal ball ten years ago you could have earned higher returns by going all in on FAANG. But since we can’t see the future, investing isn’t that easy. While it’s common for a relative few stocks to drive up overall market performance, we don’t know in advance which stocks those will be. So, instead of trying to guess or chase what’s popular, we buy the broad market to capture what’s hot now but also what could be hot later.
The following short article from Dimensional Funds answers this question quite clearly (emphasis mine). You’ll note that returns didn’t suffer that badly without FAANG stocks in the last ten years but missing a wider chunk of good performers (common with unlucky stock picking) would have sunk your returns. Here’s the article…
The stocks commonly referred to by the FAANG moniker— Facebook, Amazon, Apple, Netflix, and Google (now trading as Alphabet)—have posted impressive gains through the years, with all now worth many times their initial-public-offering prices. The notion of FAANG stocks as a powerful group holding sway over the markets has sunk its teeth into some investors. But how much of the market’s recent returns are attributable to FAANG stocks? And does their performance point to a change in the markets?
Continue reading...
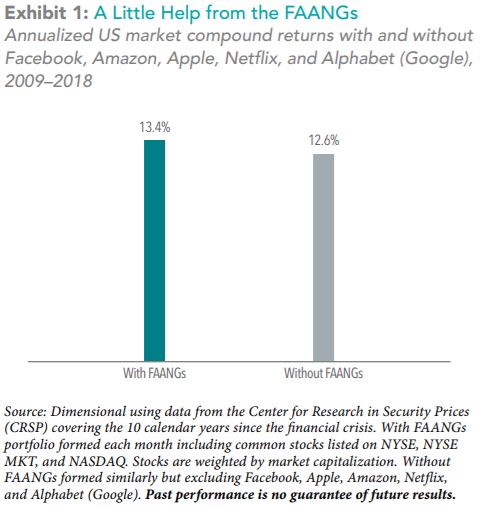
Over the 10 years through December 31, 2018, the US broad market returned an annualized 13.4%, as shown in Exhibit 1. Excluding FAANG stocks, the market returned 12.6%. The 0.8-percentage-point bump resulted from the FAANGs collectively averaging a 30.4% yearly return over the decade. Investors may be surprised to learn that it is actually common for a subset of stocks to drive a sizable portion of the overall market return.
Exhibit 2 shows that excluding the top 10% of performers each year from 1942 to 2018 would have reduced global market performance from 7.2% to 2.9%. Further excluding the best 25% of performers would have turned a positive return into a relatively large negative return. This lesson also applies to capturing the premiums associated with a company’s size and its price-to-book ratio. Research by Eugene Fama and Kenneth French (”Migration,” 2006) provides evidence that these premiums are driven in large part by a subset of stocks migrating across the market.
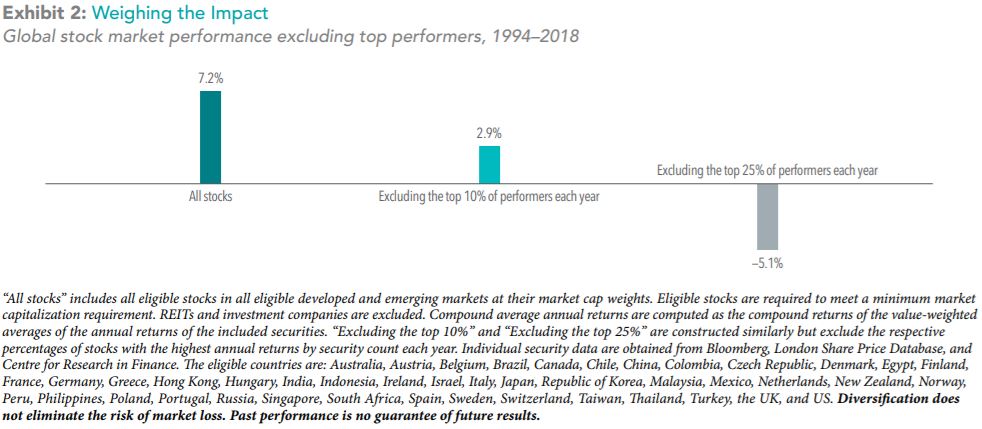
Research has shown no reliable way to predict the top-performing stocks. Looking at the top 10% of stocks by performance each year since 1994, on average less than a fifth of that group has ranked in the top 10% the following year. The tendency for strong market performance to be concentrated in a subset of stocks is therefore also a cautionary tale about the importance of diversification— investors with concentrated portfolios may actually miss out on the very stocks that deliver the best of what the market has to offer. An investment approach built around broad diversification can help achieve a more reliable outcome for investors over the long term—sharp acronym or not.
Have questions? Ask me. I can help.
- Created on .