Runups and Drawdowns
A common question lately has to do with the market runup and what to do about it. Since there's no indication of an imminent economic slowdown, the stock market could have the wind in its sails for a while yet. But as you're all aware, this can change on a dime. And since long-term successful investing has more to do with how we react to losses than gains, reminding ourselves of potential downside risk is important.
As major indexes continue to hit new highs, risk grows along with them. Think of it this way: With the Dow Jones Industrial Average (the Dow) currently at almost 26,600, a garden-variety decline of, say 1%, would mean a drop of 266 points. That could easily happen in one day and be normal. How about 532 points? That would likely freak people out but would only be a 2% decline. How about a 3% decline? While still in "normal" territory, such a drop would see 798 points shaved off the index. In a day.
I write this not to scare but to inform. Since markets have risen by a healthy amount lately, that increase makes for potentially shocking headlines about what might otherwise be ordinary declines.
For example, the largest daily point decline for the Dow was on September 29, 2008, when the index fell by 778 points (rounding up the change) when Congress failed to approve the Troubled Asset Relief Program, or TARP. Back then it was equivalent to a 7% decline. Compare that with today's market and the percentage change would be less than half that for almost the same point decline. And how about a 7% decline at today's values? 1,862 points on the Dow. Ouch.
The issue these days isn't, fortunately, a deep economic recession and near global market meltdown, it's markets being too quiet for too long. With a likely return to more normal levels of volatility sometime soon, and since this is the ten-year anniversary of the 2008 debacle, it's possible to see point declines like '08 making headlines for the wrong reasons.
The media would jump all over the superficial similarities, potentially magnifying investor fear. It's best to get mentally prepared for this so as not to be too caught off guard when it happens. And remember that it's entirely normal for markets to go through volatile periods, even as they continue higher.
Along these lines, this week I also wanted to share some bullet points and charts from Bespoke Investment Group, one of my research partners.
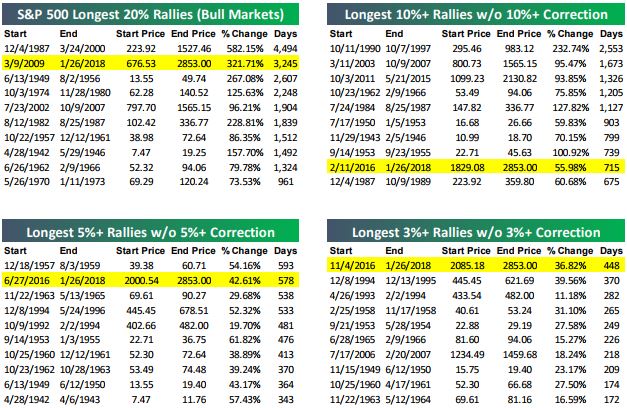
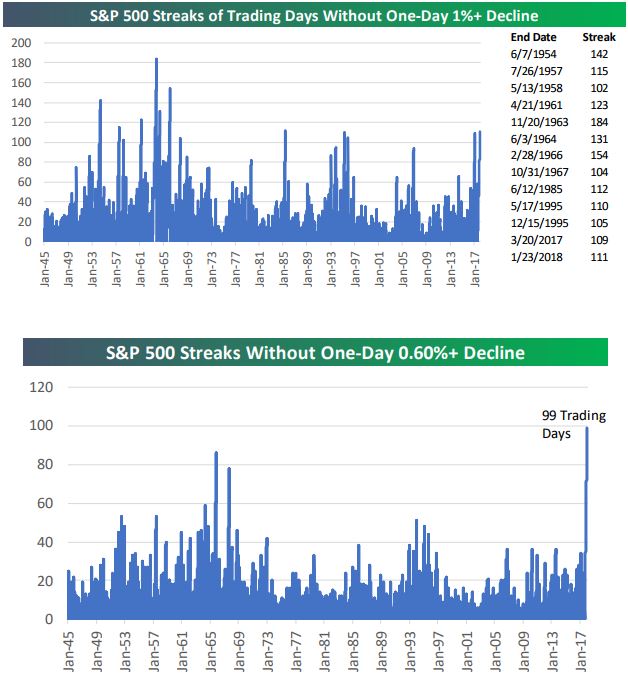
Below is an updated look at our tables highlighting the length of time it has been without a meaningful pullback for the market.
There are now just three days left in the month of January, and it's turning out to be the best start to a year since 1987.
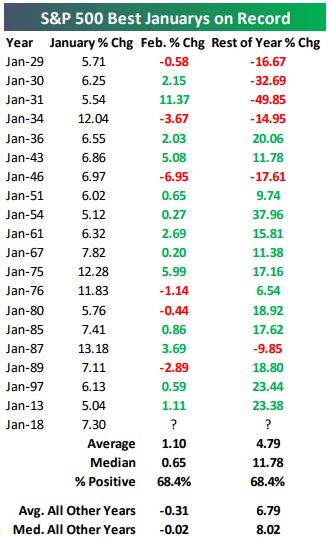
Below we highlight the best Januarys on record for the S&P 500 (all January gains of 5%+).
Following these strong starts to the year, the S&P 500 has done well in February, averaging a gain of 1.10% with positive returns 68% of the time.
For all other Februarys since 1928, the S&P has averaged a drop of 0.31%, so gains typically beget gains.
For the remainder of the year, when January has been up 5%+, the S&P has been up over the next 11 months 13 out of 19 times. But 4 of the 6 eleven-month periods that saw declines happened from 1929-1934. The last 15 times the index has been up 5%+ in January, it has rallied for the remainder of the year 13 times, and often times it has rallied in a big way.
Note, however, that the years that saw declines the rest of the way, the declines were big.
Have questions? Ask me. I can help.
- Created on .


