Happy Thanksgiving
As this is Thanksgiving week, I wanted to take a moment to express gratitude for all you have done and continue to do in support of those affected by the recent fires. Whether the deeds were large or small, within your inner circle or for complete strangers, the acts of kindness and generosity being reported lately are inspiring. It's great to see the best of us during times of tragedy.
My family and I were very fortunate in that the fires did not directly impact us, but we know many who suffered traumatic losses. The coming Holiday Season is sure to be very difficult for lots of our friends, family, and neighbors, but perhaps their struggle is made a little easier through friendship and lots of helping hands.
From my family to yours, Happy Thanksgiving. We certainly have a lot to be thankful for.
I've often written about major market indicators and how they're used as gauges to see how well the economy was doing (lagging indicators), how it's doing now (coincident indicators) and, most importantly, how it's likely to be doing in the near future. These forward-looking, or leading indicators, incorporate data from the manufacturing sector, jobless claims, interest rates, the money supply, consumer confidence, and others. The S&P 500 is a leading economic indicator.
Ever since the Great Recession these indicators have largely shown an economy that's on an upswing and the stock market has benefitted from this. As of last month, the indicators were starting to show some acceleration. Still, everyone wants to know when the next recession is likely to start. At least by watching the indicators, it's not anytime soon.
Click below to read a quick update on this topic from my research partners, Bespoke Investment Group (emphasis mine).
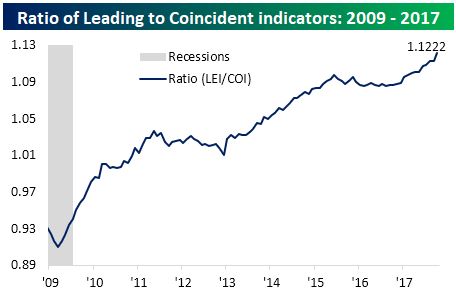
Leading indicators for the month of October were released earlier this morning and showed a much larger than expected m/m gain, rising 1.2% compared to expectations for a gain of 0.8%. This month's gain was the largest m/m move higher since November 2013 and the biggest beat relative to expectations since April 2010. Within each month's report on leading indicators, we like to compare the moves in that index to an index of coincident indicators (which is released at the same time) in order to see how forward-looking indicators look compared to current indicators. When leading indicators are rising faster than coincident indicators, it indicates that the economy is accelerating, while periods where leading indicators are rising slower than coincident indicators, indicates that the economy is slowing down. As shown in the chart below, the ratio between these two indices has taken a new leg higher to its highest levels of the recovery.
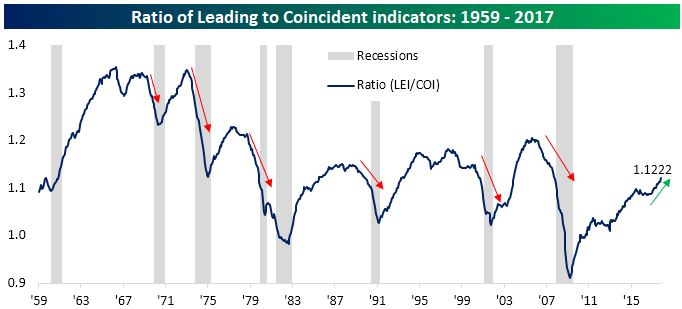
From a longer-term perspective, the current ratio between the two indices currently stands at 1.1222, which is the highest reading since September 2007. While the ten-year high in this ratio is noteworthy, its direction is even more important. Going back to 1959, this ratio has been a great predictor of recessions, where a multi-year peak usually leads a recession by about a year to a year and a half. While there have been exceptions where the ratio turned lower and then moved higher again with no recession occurring (the mid-1990s and mid-1990s), there has never been a period where the ratio between the two indices was rising heading into a recession. With that in mind, the current peak in this ratio suggests that any possibility of a recession is at least a year away.
Have questions? Ask me. I can help.
- Created on .


