The Smartest Bird in the Room
You may have heard how individual investors tend to underperform the "professionals" over the long run. While this might seem like a self-serving statement coming from one of those professionals, it's actually true.
While there are many reasons for this, something simple causes a big part of the outperformance: staying invested during difficult times. By not trying to trade in and out of investments, or trying to "beat the market", the diversified long-term investor has an automatic upper-hand over the reluctant trader. Why? Because history shows that if an investor misses the best days while trying to avoid the worst, they quickly find themselves behind, even though they're trying to do what seems like the right thing.
JPMorgan publishes research on this and shows that, for example, missing the ten best days from 1995 through 2014 would have cost the investor about 38% of their return potential. Missing the best 20 days would have cost 60%, while missing 40 or more days would have caused the investor a negative return. How could your return be negative after 20 years? Well, it's possible and often due to poor timing.
An interesting factoid about the ten best days during this period is that six of them occurred within two weeks of the worst ten days. You can imagine how it happens. An investor sells because they're frightened by falling prices, only to find the market rockets up a few days later. This can leave them feeling like they missed the train and are watching it leave the station. It's understandable when investors say they just don't understand what's happening in the markets.
Compounding the problem is the sheer amount of information and analysis available these days. Various people all over the world spend a ton of time trying to predict if markets will go up, down, stay flat, be calm or volatile, the list goes on and on. Many of these people have an agenda and it can be difficult to tell what it is. But the bottom line is that none of them really know or can predict with a high level of certainty what will happen in the future. Useful insights, yes; fortune-telling, certainly not.
Continue reading to view some interesting charts from 2016.
Take last year as an example. With the benefit of hindsight, many early predictions about what would drive markets during 2016 turned out to be flat wrong, and the headlines throughout the year where all over the place. If an investor made big changes based on these predictions they could quickly have found themselves underperforming or worse, feeling like the ostrich is the smartest bird in the room.
Since we're at that early stage again, with lots of predictions and uncertainty looming, it's good to put things in perspective.
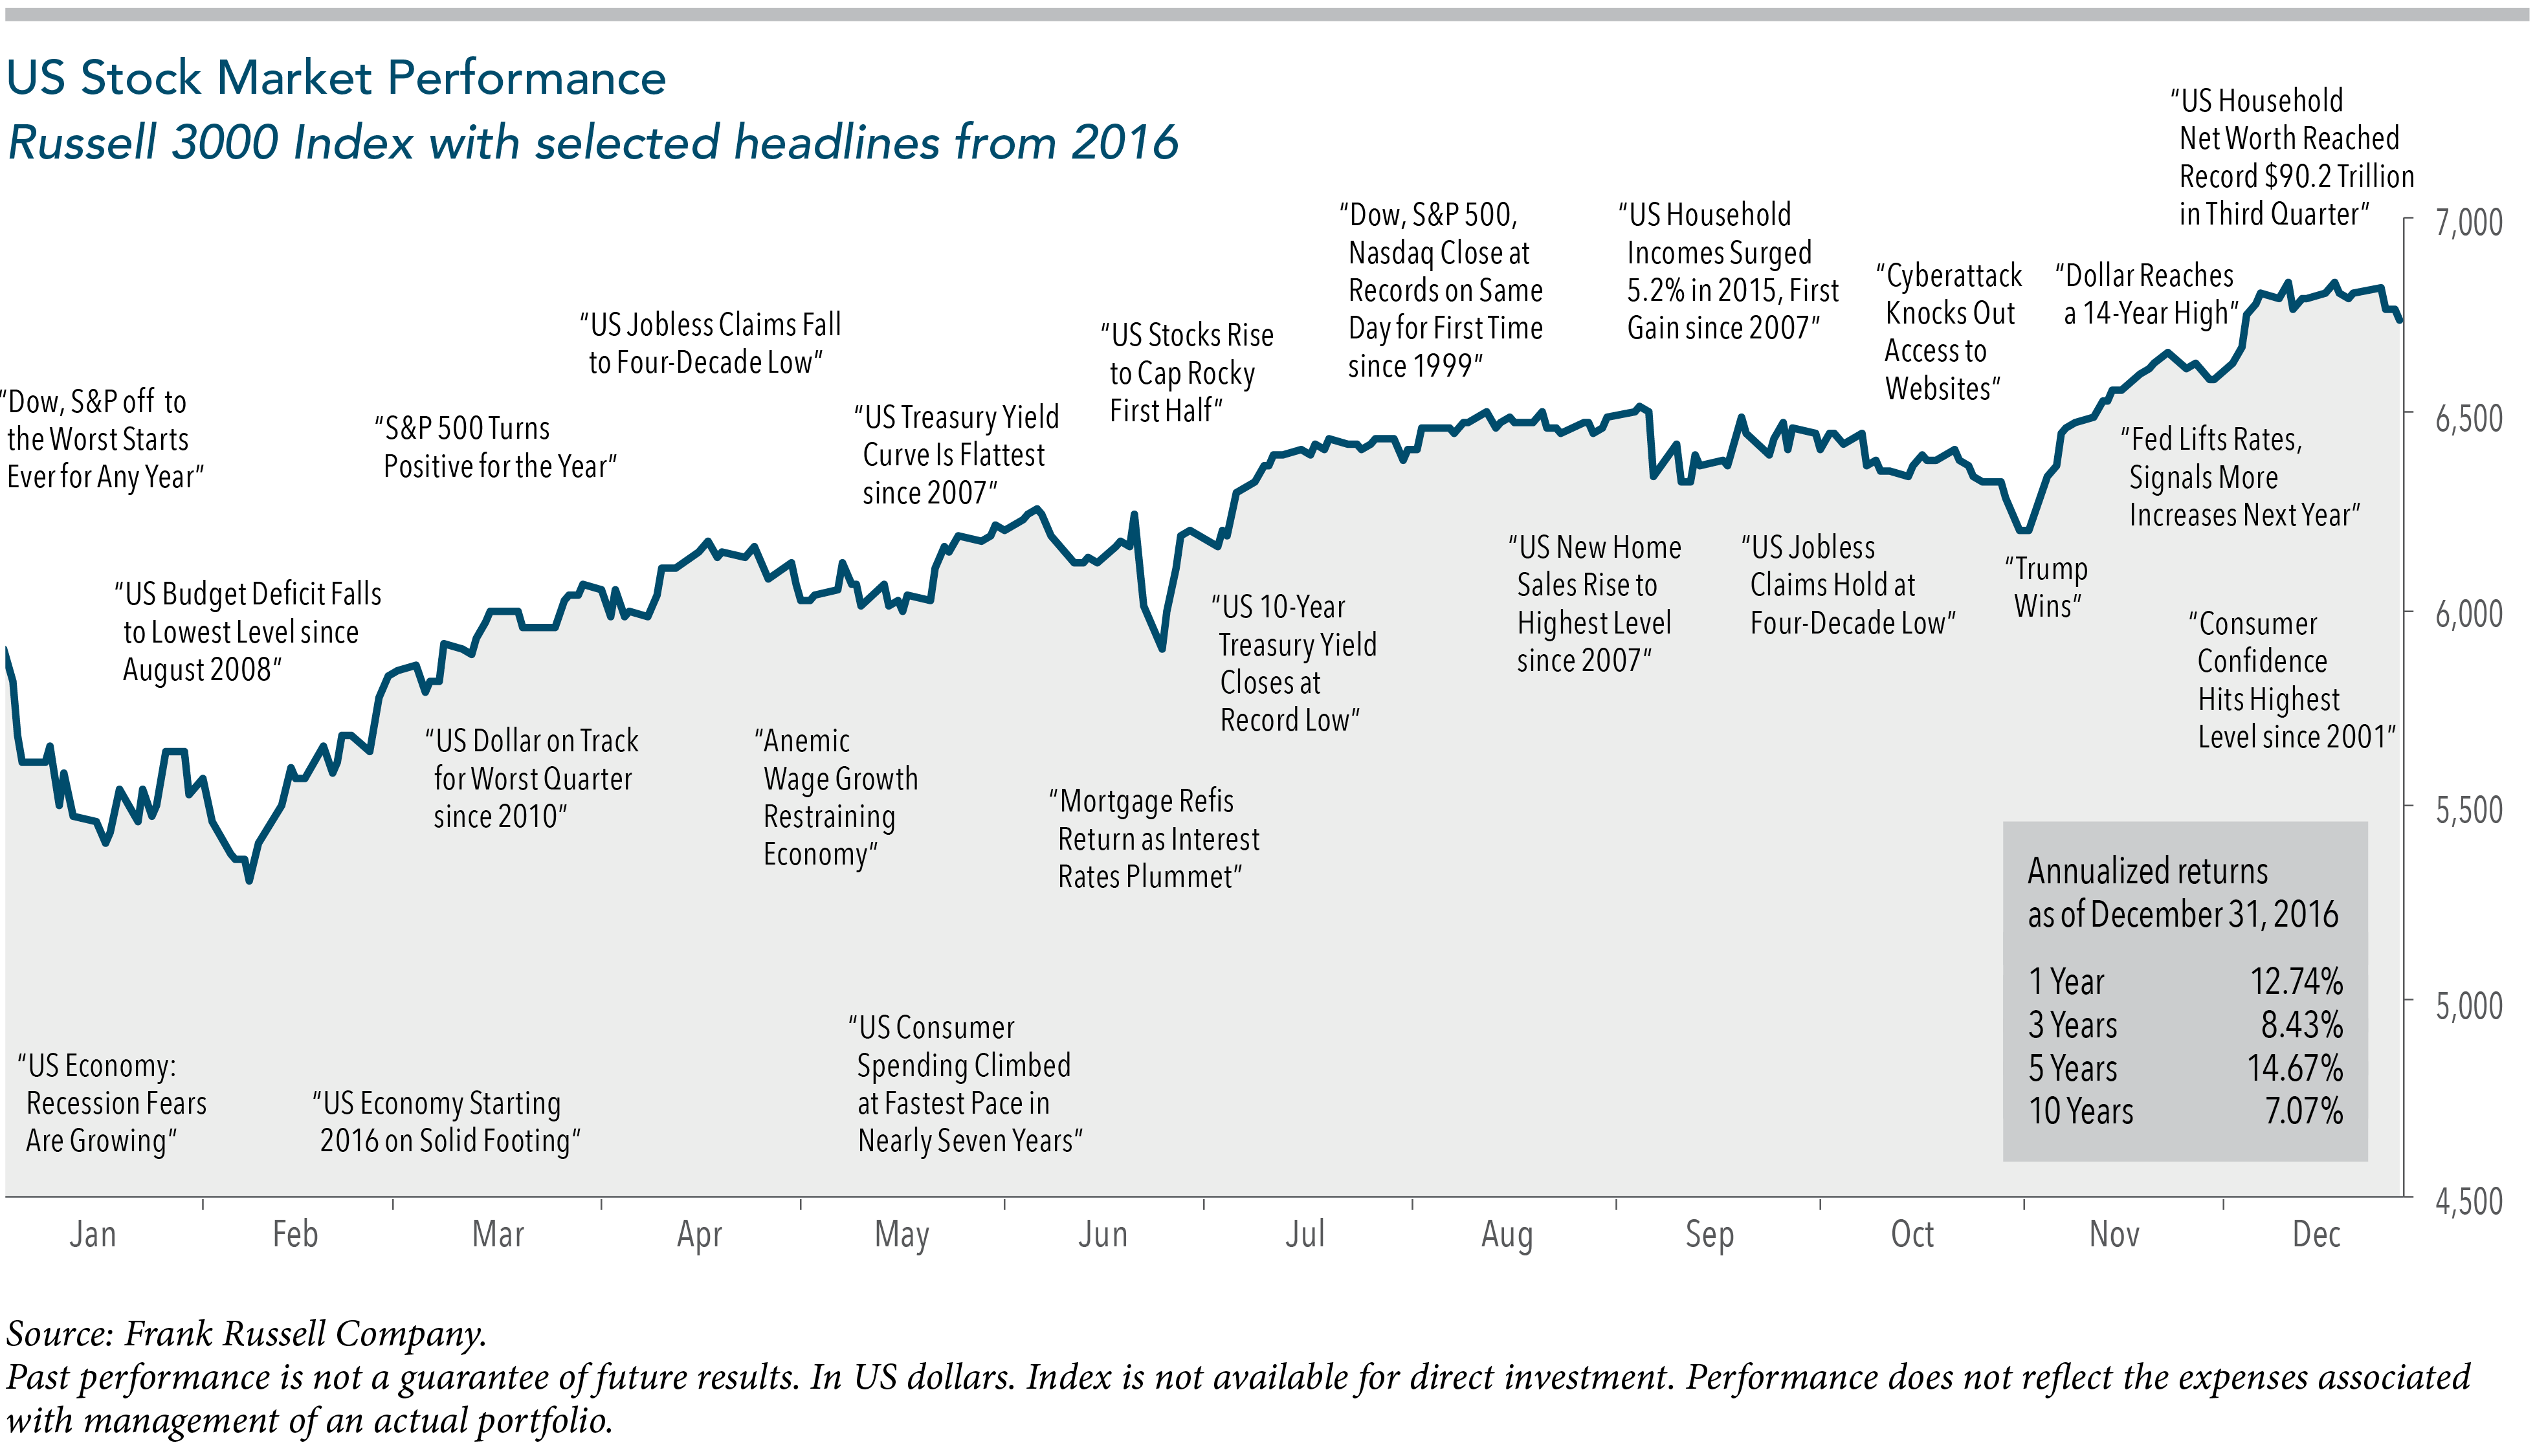
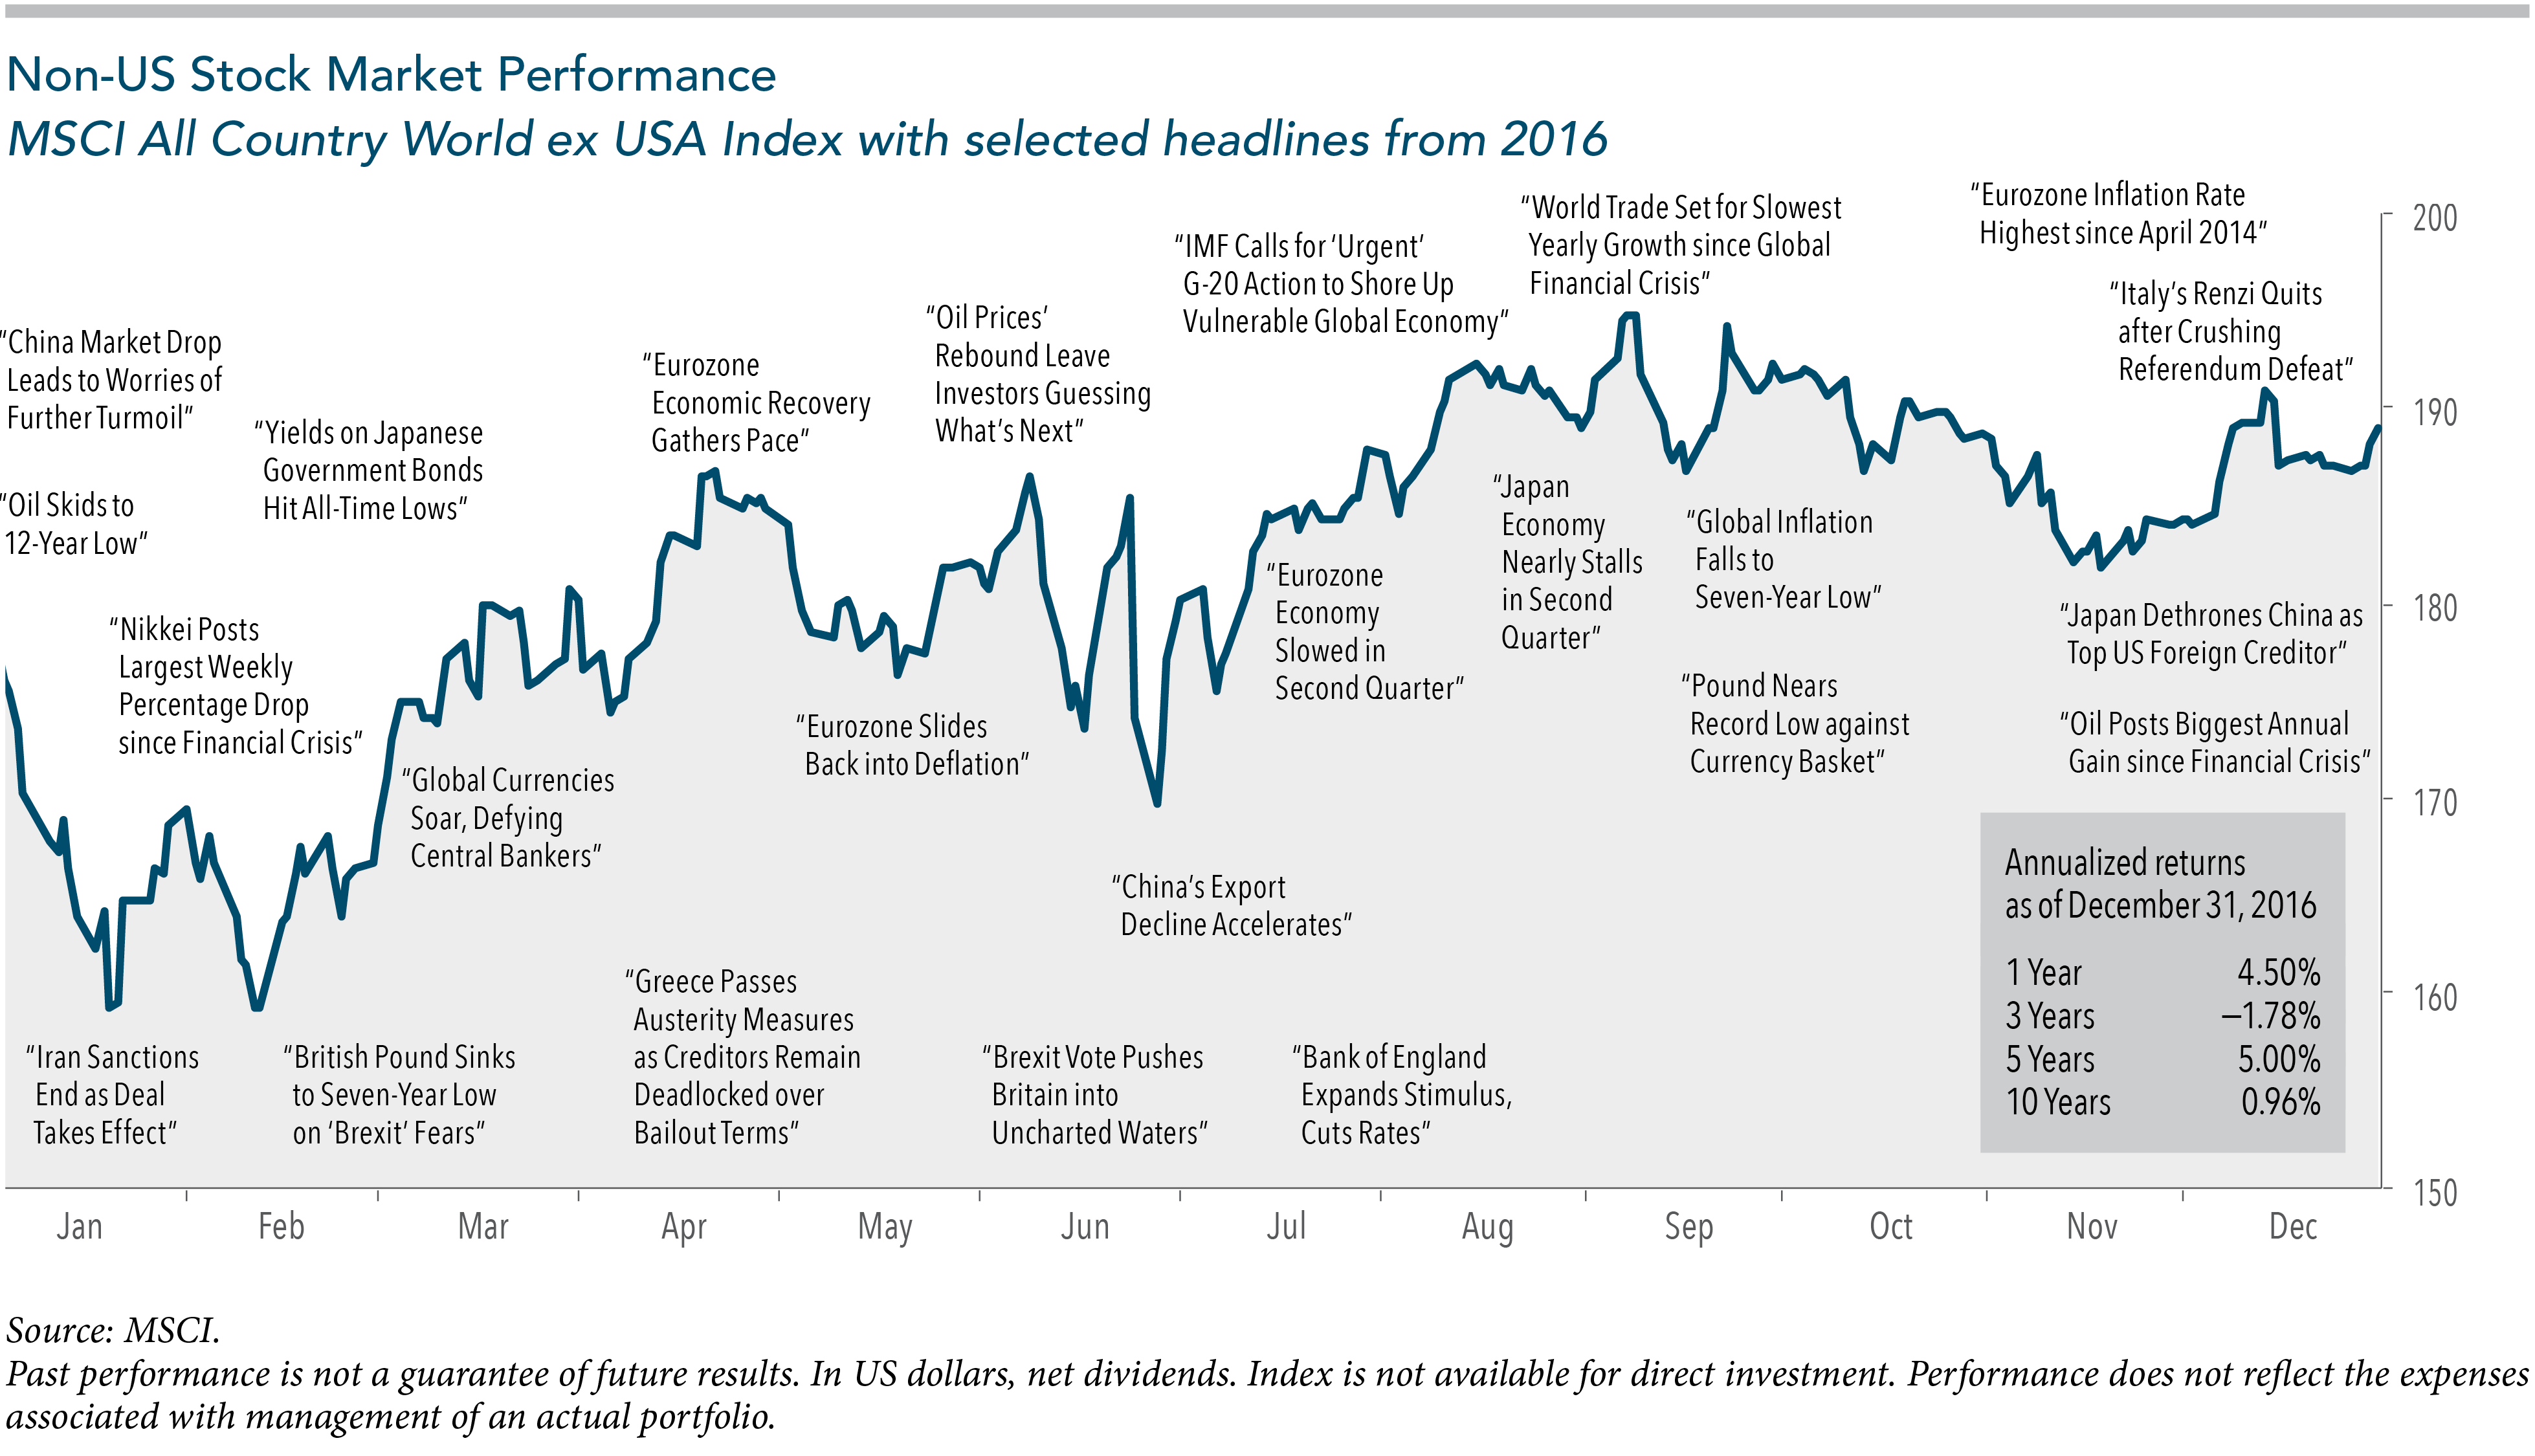
Look at these two charts recapping market activity and some news headlines in 2016. The first shows the Russell 3000, a good proxy for the U.S. stock market. The second is the MSCI All Country World Index ex USA, a proxy for the rest of the world. Both charts demonstrate how markets will go up and down, sometimes dramatically, but they do go up over time.
Diversification and quality matter, as does keeping costs low and transparency high. But the most important factor is time in the market, and not "timing" the market.
Have questions? Ask me. I can help.
- Created on .


