We hear about slowing economic growth at home and around the world, but it’s interesting to see what consumers are actually doing with their money. It turns out that consumers here and in China are doing okay and are quite willing to spend, at least for now.
While not an official state holiday, Singles’ Day has become an important consumption day in China. If you haven’t heard about this before, you can think of the day as being a much larger version of our Black Friday.
Recognition of 11/11 each year is said to have begun in the 1990’s as a celebration of being single in China, with the 1’s in the date representing being single and then being paired as a couple. People go on blind dates, some choose it as their wedding date, others pamper themselves or… buy stuff online. In the last ten years or so Singles’ Day has turned into a massive sales event with Alibaba (the Chinese e-commerce giant similar to Amazon) displaying total sales in real time and kicking things off this year with a live performance by Taylor Swift!
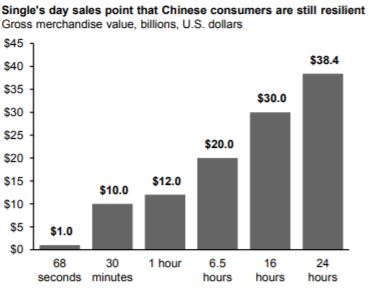
Last year Singles’ Day sales were almost $31 billion. This year Chinese consumers spent $38 billion and, according to JPMorgan, surpassed in less than 12 hours the $24 billion US consumers spent last year during our five-day Black Friday weekend. The chart below, again from JPMorgan, shows how sales increased as the day went on. Granted, China has about a billion more people than we do, but they still spent more than us proportionally.
I hope you’re getting back to some sense of “normal” after a crazy week or so due to the Kincade Fire. For me, it’s good to be back home and back in the office. I hope you and yours did okay, all things considered.
This week I wanted to address a question posed to me by a client about skipping the “broad market” and simply investing in the so-called FAANG stocks (the acronym is explained later). While it might sound like an interesting idea because the big tech names have been performing well lately, casting aside a diversified portfolio for a handful of stocks is probably a bad idea.
However, if you had a functional crystal ball ten years ago you could have earned higher returns by going all in on FAANG. But since we can’t see the future, investing isn’t that easy. While it’s common for a relative few stocks to drive up overall market performance, we don’t know in advance which stocks those will be. So, instead of trying to guess or chase what’s popular, we buy the broad market to capture what’s hot now but also what could be hot later.
The following short article from Dimensional Funds answers this question quite clearly (emphasis mine). You’ll note that returns didn’t suffer that badly without FAANG stocks in the last ten years but missing a wider chunk of good performers (common with unlucky stock picking) would have sunk your returns. Here’s the article…
The stocks commonly referred to by the FAANG moniker— Facebook, Amazon, Apple, Netflix, and Google (now trading as Alphabet)—have posted impressive gains through the years, with all now worth many times their initial-public-offering prices. The notion of FAANG stocks as a powerful group holding sway over the markets has sunk its teeth into some investors. But how much of the market’s recent returns are attributable to FAANG stocks? And does their performance point to a change in the markets?
One of the things I love about financial planning as a profession is that there’s no shortage of good stuff to read and ponder over, and call it work. One day it’s investing topics, the next its emerging insights from behavioral finance and neuroscience. That’s probably what I’d do with that 25th hour of the day – read more. It would certainly be better than watching the news!
Along these lines I recently read a book that, in part, invited the reader to create a relationship with their “future self”. Not some stylized version of who you hope to be, but an older version of yourself five, ten, twenty years in the future. You’d then develop a regular dialogue with Future You. Even daily.
The idea is that Future You would help you understand what to do (or not do) today to stay on track for accomplishing things that were ultimately (according to Future You) the most important. Maybe its eating better and exercising, spending more time with family, or even getting in to see your dentist more often. And Future You isn’t going to blow smoke, right? They would be honest, and even plead with you to do what you probably think is right anyway.
It turns out this concept is a growing field of research that has direct implications for financial planning. This makes good sense because having a healthy picture of one’s future self informs decisions involving delayed gratification, such as saving for retirement, for example.
The following are excerpts (emphasis and additions mine) from an article on the topic. I’m including a link to the full article below. The content is meant for financial advisors, so you’ll see some references to the target audience.
Future self-continuity (FSC) is the connection and perceived association between who you are today and who you will be in the future. The idea and theory of future self-continuity were developed out of research focused on understanding and curing the problem of future discounting, which is the human tendency to place less importance on future rewards when compared to current rewards. And because of this tendency, it can become very easy to put off (or even ignore) behaviors associated with future rewards, from simple ‘bird in the hand’ scenarios (e.g., taking $50 today instead of $60 next week), or (not) saving and investing for retirement.
The world of investing is a strange place. Some months ago, the yield curve, or the difference in yields paid by bonds of different maturities, inverted. Since yield curve inversions are a near-perfect recession indicator, much ink was spilled discussing it. Understandably, investors were focused on when a recession would hit. Many analysts thought that maybe a year or two out was a good expectation.
Fast forward to today and it seems like investors couldn’t be bothered to consider such a thing. Barring day-to-day volatility driven largely by trade tension headlines, stocks have continued to rise. The Dow Jones Industrial Average and the S&P 500 have both recently hit record highs. But aren’t we supposed to be edging toward recession? How can stocks keep going up?
This summer the Federal Reserve started lowering interest rates in response to fears about the economy slowing and trade-related uncertainty. Since then they’ve dropped short-term rates 0.75% and this, probably more than anything else, has helped investors ignore the yield curve inversion. But then the yield curve began to steepen recently and is no longer inverted! What’s an investor to think?
Does all this mean our recession fears were unfounded? Does it mean stocks can rise indefinitely? The answer to both questions is no, but stocks can continue to rise for a while because the stock market loves low interest rates, even in the face of growing problems such as low inflation, declining business sentiment and the continued slowing of the manufacturing sector. And the love affair strengthens when investors have been assured rates will stay low for the foreseeable future.
My research partners at Bespoke Investment Group explained this through an interesting metaphor following the Fed’s rate setting meeting in October.
“It was almost the equivalent of your parents telling you on a Friday that they were going away for the weekend and wouldn't be back until Monday at the earliest. In other words, party this weekend!”
The partiers in this case are investors and the keys to the house (and the liquor cabinet) are low rates supplied by the Fed (the parents). Historically, yield curves tend to re-invert after being inverted as long as they just were, so that will be something to watch out for in the coming weeks and months. Another inversion would certainly stoke the recession fires again. By the way, analysts are still predicting a coming recession, just maybe a little farther away than originally thought.
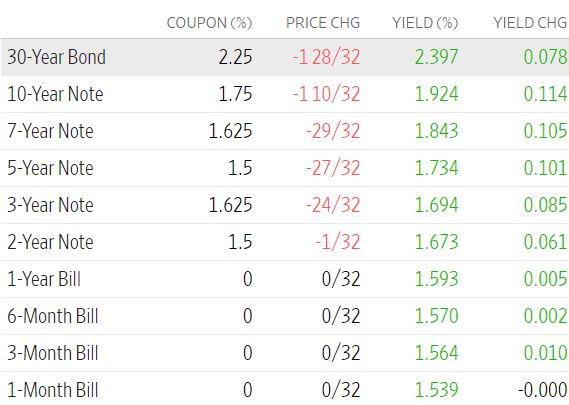
If you’re interested, here’s a list of yields from the Wall Street Journal as the bond market closed on Friday. You’ll see the yield percentage being higher with the 30yr bond and then declining at each separate maturity step down to one month. This is what a normally sloped yield curve looks like, albeit with historically low rates across the board. Flip this around and make the shorter maturities yield more than longer-term and you’ll get a sense of how backwards yield curve inversions can look.
During this challenging time I wanted to update you on our status. As with much of Sonoma county, my family was evacuated over the weekend but we're now set up at a family member's house out of the area. Brayden, my assistant, is staying out of the area as well. Our office building is also in the mandatory evacuation zone. Fortunately, most of our business is in "the cloud" and being in a different location is only an inconvenience. So, it's business mostly as usual until we get the all clear.
My family and I wish you and yours a safe next several days, or however long this latest fire event lasts. In the meantime, please know that you can reach out with any questions.
Before we begin, I wanted to let you know about an important development. A week or so ago TD Ameritrade joined Schwab in the so-called “race to zero”. Fidelity jumped on the bandwagon in recent days too. The result is that all three major online brokerage firms now charge zero trade commissions to buy and sell stocks and exchange traded funds. This is great news for investors.
This week’s post is part of a series about backing into your asset allocation, a multi-step process to 1) determine your annual spending needs in retirement; 2) use history as a guide to get a feel for how long a stock market downturn could last; 3) figure out how much to invest outside of the stock market to provide spending power during a downturn; and 4) how to reconcile all of this with the reality of your portfolio and tolerance for risk.
As a reminder, our simplified example looks at a couple of retirees with a planned $15,000 spending deficit next year. They were planning to spend $90,000 total, including basic needs of about $75,000 plus $15,000 for discretionary spending (travel, painting the house and landscaping). They were expecting $75,000 of income. They’ve looked ahead and assume this spending rate will continue for the foreseeable future but want to cover themselves should the stock market go through a multi-year whacky phase.
Our couple decided they’d like to hold four years’ worth of spending deficits outside of the stock market. They opted not to use four years of total spending ($90K X4 = $360K) in their calculation because it was way too high relative to their $500,000 investment portfolio. But they also felt four years of $15,000 deficits (or $60K) was too low, leading them to round up to a target of $100,000, or 20% of their current portfolio.
Comparing this to their actual portfolio they find they currently have 40% invested outside of the stock market. This was the result of a “moderate” score during a risk tolerance questionnaire they completed suggesting a portfolio mix of 60% in stocks and 40% in bonds and cash. This is different from their work to back into their allocation. Which process is correct?