Who's Worried About Inflation?
Inflation is on the minds of many this Thanksgiving week. We’re seeing higher prices on just about everything planned for the table, at the pump on the way to the store, and all points in between. There’s also the growing issue of shrinkflation, or having to pay the same price for less. This was happening pre-Covid, of course, but has only gotten worse since.
Unfortunately, nobody knows where prices go from here or when it will get better. As we’ve discussed previously, our chief inflation fighter, the Federal Reserve, expects that the recent spike in prices will be short-lived. It’s due to complex supply chain issues and unexpected pandemic-driven changes to consumer behavior (hoarding, shifting priorities, etc), even inflation expectations themselves, all forces that should ease during 2022. But other inflation drivers like rising wages amid labor shortages and the so-called Great Resignation, seem likely to linger. Only time will tell if the Fed is right.
That said, I don’t think inflation is of grave concern yet. The economy continues to grow and that’s expected to continue well into next year, perhaps beyond with all the stimulus money in the system and what’s yet to come. But it would be silly not to worry.
It’s also prudent to ask about the potential impact of not-so-transitory inflation on the stock market. We know that stocks are one of the best tools we have to fend off inflation from hurting our personal finances over the long-term, but they can be rocky when investors get nervous. Investors have so far only shown mild interest toward inflation, and sentiment can turn on a dime. So what does history tell us about how the market reacts to extended bouts of inflation?
Here’s some information on this subject from my research partners at Bespoke Investment Group…
Continue reading...
- Headline y/y CPI has now been at or above 5% for six straight months.
- There have only been six other periods post-WWII where y/y CPI was at or above 5% for a half year or more.
- Equity market returns following prior periods where y/y CPI was at or above 5% for a half year or more were mixed, but there was a decent link between performance and how persistent inflation was.
- Periods where the elevated y/y readings of CPI quickly eased back down below 5% were accompanied by positive returns for equities while the periods where inflation remained elevated tended to see weakness in equities.
With y/y headline CPI coming in at 6.2% this month, it has now been six straight months where the headline reading has been at or above 5%. With that streak, the current period now joins just a small set of other periods where y/y CPI has been at or above 5% for a half year or more. As shown in the chart below, there have only been six other periods to reach this milestone with the most recent occurring in 1991. Of the remaining five periods, three spanned the period from 1970 through 1982, while the other two were in the decade following WWII.
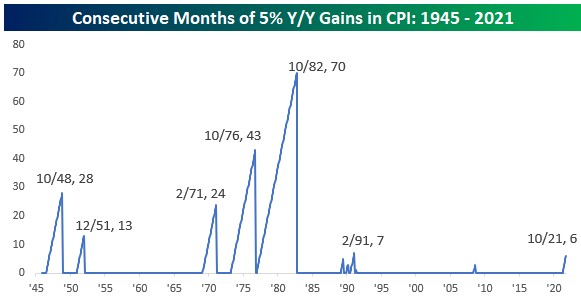
While the current streak of 5%+ increases in y/y CPI joins only a handful of other periods since the end of WWII, the lengths of the five other streaks vary widely. The longest of these, ending in 1982, lasted 70 months, or nearly six years! The next longest streak was more than three and a half years (1976), two others were two years or more (1948 and 1971), and just two were less than two years. With equities reacting negatively to [the recent] hotter-than-expected CPI report, investors want to know what this now 'persistently transitory' inflation means for equity market returns.
To help answer this question, we looked at how the S&P 500 performed following the sixth month of each prior streak where y/y CPI was at or above 5%. Looking at forward returns following each of these periods, the results are mixed to say the least. In three periods, the S&P 500 was down three, six, and twelve months later, while another two periods were followed by positive returns over the following three, six, and twelve months. Lastly, the period following the sixth month of the first post-WWII streak was followed by what can only be characterized as flat returns over the following three, six, and twelve months.
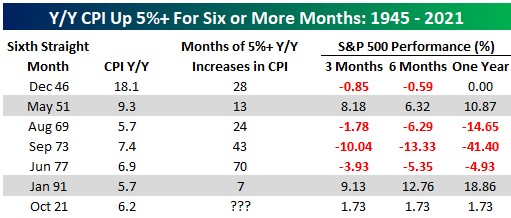
Looking at the results in a little more detail, one thing the two periods of positive returns have in common is that the elevated inflation readings did in fact end up being transitory. The streak in the early 1950s ended up lasting just over a year (13 months) while the streak in the early 1990s ended at seven months. At six months, the current streak still ranks at the short end of the spectrum relative to prior streaks, so bulls don't need to panic yet. But the longer we see these elevated readings, the more of a headwind it will likely become for equities.
Have questions? Ask me. I can help.
- Created on .


