Defining Recessions

Are we in a recession? We touched on this question last week and it’s worth revisiting for a few minutes this morning. Recessions are nebulous things, difficult to pin down in the moment, and everyone has an opinion. The dates and other specifics around a recession are important, however, so it’s good to understand some of the fundamentals.

There are multiple ways to define a recession. The typical back of the envelope method is seeing at least two consecutive quarters of declining GDP. The first quarter of this year saw GDP fall over 1%. The second quarter was on track to be flat, or perhaps slightly negative and, if so, you could say we’re in a recession now. Seems pretty simple. But as with most simple things there’s always more to the story.

For starters, most of us view the question from a non-academic perspective anyway. If we feel like we’re in a recession, we’re in one. Opinions about this are perhaps informed by the feeling of moving backward due to inflation and the sense of inevitability it brings. For others it’s the loss of a job setting them back for weeks if not months. Others bake politics and overall sentiment into how they see our economy getting better or worse. By this sort of reckoning some suggest that we’ve been in a recession for years. Again, lots of opinions. Last Friday was the 43rd anniversary of President Carter’s “malaise” speech and, if nothing else, listening to it in our current environment provides an eerie reminder of just how closely history can rhyme.

But there’s a broader, formal definition of recession that’s generally considered correct. A committee within the National Bureau of Economic Research (NBER) looks for a “significant decline in economic activity that is spread across the country and lasts more than a few months” before calling the beginning and ending of each recession. NBER tracks a variety of information and focuses on the “direction of change” to find the peaks and troughs occurring over time within our economic cycle. All this is dependent on data that takes time to assemble and is why recessions are identified only after the fact, sometimes well after because the data often go through multiple revisions. NBER’s work is also subjective because they decide how important some metrics are versus others at a given point in time.

That brings us to my main point this morning. Recessions often follow a general playbook but no two are exactly alike. And our next one, whether it’s now and NBER just hasn’t named it yet, or is down the road, it’s likely to be very different from prior recessions due to the dislocations (for lack of a better term) caused primarily by our response to the pandemic. For example, there’s a large number of available jobs in our economy even as economic activity slows. No prior recession since WWII has seen this combo. Is the job market just waiting to roll over? Why are companies still posting jobs if, as some suggest, the outlook is so poor?

Along these lines, here’s a five-minute video that does a great job describing the complexity of our current environment. Let me know if you get blocked by the paywall and I can try to send you the link direct from my account.

https://www.wsj.com/video/series/wsj-explains/why-a-2022-recession-would-be-unlike-any-other/52127788-B3C8-496C-A31F-B6127425F4BC

And here’s a link to FAQs on NBER’s website to get more information on how they do what they do.

https://www.nber.org/business-cycle-dating-procedure-frequently-asked-questions#:~:text=A%3A%20The%20NBER's%20traditional%20definition,more%20than%20a%20few%20months.

Have questions? Ask me. I can help.

  • Created on .

Quarterly Update

The second quarter of 2022 (Q2) was one that most investors were anxious to put behind them as it rounded out the worst first half of a year for stocks in five decades. Inflation, Federal Reserve policy decisions, and recession fears supplanted Russia’s February invasion of Ukraine as the key issues for markets. And as sentiment followed stock prices down throughout the quarter you had to squint to see the few bright spots along the way.

Here’s a roundup of how major markets performed during Q2 and year-to-date, respectively:

  • US Large Cap Stocks: down 16.1%, down 20%
  • US Small Cap Stocks: down 17.3%, down 23.5%
  • US Core Bonds: down 4.6%, down 10.2%
  • Developed Foreign Markets: down 13.2%, down 18.8%
  • Emerging Markets: down 10.4%, down 17.2%

Stock prices around the world fell during the first quarter, but declines accelerated during Q2 as risk assets in general were hit hard. Bitcoin and other digital assets suffered major losses due to overall risk-off sentiment and some heavily-levered (and simply ridiculous) portions of that market fell apart. US Large Cap stocks as measured by the S&P 500 entered a technical bear market (a 20+% decline from a recent high) during Q2. Losses came quickly with multiple stretches of back-to-back 1% - 3% declines and a 10+% drop during one week in June. The tech-heavy NASDAQ 100 ended the quarter down about 28% year-to-date, with most of that decline occurring in Q2. Within the various market sectors, Communication Services and Consumer Discretionary put up the poorest showing, down about 23% and 26%, respectively, for the quarter and 30% or so year-to-date. The only positive sector in the US has been Energy, up around 31% year-to-date while still posting declines of about 5% during Q2.

Driving much of the poor performance was evolving concerns about inflation and how the Fed would react to it, continued pandemic-related supply chain and commodity markets disruptions due to Russia’s invasion of Ukraine (which helped the Energy sector), and the interconnectedness of it all potentially leading to a recession.

Inflation hit 8.6% during May, a multi-decade high, with prices for housing, gas, and food the largest contributors. This price surge kicked into gear last October but really caught up with markets and the Fed during Q2. Some miscommunications about the perceived seriousness of the inflation problem accompanied two rate increases from the Fed, 0.5% in May followed by 0.75% in June, the largest increase since 1994. During Q2 the Fed reaffirmed (or shifted gears, depending on your perspective) that its first job, maintaining stable prices, is required to handle their second job of maintaining full employment within the economy. The Fed’s primary method for tempering inflation is to slow the economy by raising interest rates, a blunt tool that is tough to wield without triggering a recession. Investors grappled with this during Q2 without any meaningful resolution as the quarter closed. Accordingly, the aforementioned few bright spots occurred around soothing words from the Fed about future rate increases or data showing an economy already slowing, implying the Fed could raise rates less aggressively and be less likely to make things worse.

Bond prices fell less in Q2 than during the first quarter and provided some support to portfolios but were still volatile due to the same issues impacting stock prices. The broad bond market fell about 4% during Q2 and is down about 10% this year. Bond yields rise as prices fall and the 10yr Treasury yield, a key benchmark, rose to 3.6% before closing out the quarter at about 3%. This caused the average 30yr mortgage rate to briefly hit 6.3% before backing a bit as Q2 ended – but still almost double where it was just six months ago. These rapid changes in bond yields and the cost of borrowing act as roadblocks for inflation but could also help spur a recession.

The outlook was mixed for much of Q2, and little clarity exists as we begin the second half of the year. A variety of economists and market watchers continue to scratch their heads at the odd juxtaposition of data showing continued pent-up demand for certain goods and services in our economy and a strong job market, coupled with declining consumer sentiment and confidence about the future. Most economic indicators seem to be telling us that we’re not in a recession now, while some appear to be rolling over. And the inflation problem was showing some potential signs of moderating as we closed Q2. All this complicates any clear narrative about the near-term path for growth. In short, the economy isn’t following the typical playbook and this, perhaps in hindsight, should have been expected after such a tumultuous period.

Numerous market sentiment surveys were flashing red as we ended Q2. For example, a survey from the Conference Board found that only 26% of respondents expected higher stock prices a year from now, a ten-year low. In light of this it’s understandable that some retail investors have been throwing in the towel. But history shows that such poor sentiment usually leads to strong returns a year out and is why such survey results are viewed as a contrarian indicator. For us, amid continued uncertainty the main job continues to be ensuring our portfolios are set up correctly, rebalancing as needed, and buying stocks and bonds on weakness as appropriate. This isn’t much fun during times like these, but the decisions we make today will absolutely impact our tomorrow.

Have questions? Ask me. I can help.

  • Created on .

60/40 Gets Pummeled

This has obviously been a bad year so far for long-term investors. Pick your asset class and it’s down year-to-date, and some are down much more than others. The real letdown, however, has been the bond market’s poor performance. We’ve talked about this and the reasons why before, but what’s interesting now that we’re near the halfway point this year is seeing how bond returns have impacted the traditional 60/40 stock/bond mix that is so prevalent across portfolios.

I’ve included some recent work on this topic below from my research partners at Bespoke Investment Group. But to give this some scale let’s first look at a couple of charts showing three major asset classes: US stocks (the green line), foreign stocks, (in blue), and US bonds (in orange). To these I’ve added a super-basic 60/40 portfolio mix (in lavender) so we can compare performance.

The first shows dates I cherrypicked from October 2008 through March 2009, the worst of the Great Financial Crisis. Owning the right kinds of bonds helped back then while the stock market was going nuts. It didn’t magically make your performance positive but took the edge off as shown in the spread below. Charts like this foster a certain amount of reliance on bonds as a source of strength within a portfolio.

Now let’s look at this year so far, a year that among other things has turned into one about interest rates (kryptonite for bonds). We see bonds falling more or less in tandem with stocks and a lack of the positive spread shown in the chart above. There have been glimmers, but they haven’t held very long.

This performance tracks along with growing inflation fears and concerns about Fed interest rate policy and if/when it might trigger a recession. The Fed, as you’ll recall, briefly soothed investors in May and we see that in the orange line moving up that month. But then the Fed ripped off the Band-Aid recently with its largest single rate increase in decades to combat inflation at a 40yr high. Rate increases impact markets in a variety of ways but this time it’s sort of twisting the knife, so to speak, in the backs of investors who are merely trying to do as they’re supposed to by practicing the battle-tested approach of asset allocation. “Fairness” isn’t really something that fits within the context of stocks and bonds, but one shouldn’t be blamed for feeling a bit ill-treated by the markets this year.

Where to go from here? As I’ve mentioned before, at some point soon (hopefully) we’ll get to that point of ultimate capitulation and buyers will come back home to stay. In the meantime it’s all about ensuring your portfolio is structurally sound, rebalancing as needed, and harvesting losses as appropriate. Not much fun these days but critical in building and maintaining your portfolio for the duration.  

From Bespoke…

We are only halfway through June, but a 60/40 portfolio continues to get crushed by the combination of soaring bond yields and new equity bear market lows. Using mid-month data from June, a 60/40 portfolio is down nearly 18% in 2022. A similar asset allocation has started the year down over 6% twice previously, in 2002 and 2008. Nothing else comes close to the losses this year. Even looking at all six-month periods, the move since the end of last year is among the worst ever recorded. During 2008-2009, the utter collapse of stocks was a brutal hit to performance. But despite an enormous surge in credit spreads [this happens when investors sell risky bonds and buy safer Treasurys], bonds didn't drop very far or for very long. That's because Treasury yields plunged, driving gains from the risk-free component of the bond market. This time around, though, it's a very different story. While credit spreads have widened, far more important has been the huge surge in Treasury yields [investors sold Treasury bonds and caused yields to rise]. As a result, bonds have delivered -11.7% total returns this year, adding to - and arguably causing - the collapse in equity prices rather than offsetting the stock bear market.

We hope decision-makers (like the Fed) and pundits saying that we still need to see a "market flush" truly appreciate the wealth destruction seen so far this year. [Last week], Chair Powell thought financial conditions including equity performance were "appropriately" tightening, signaling he and other FOMC policymakers are satisfied with the pain in stock and bond markets. For the "average" person that only has a 401k retirement plan that's set to a 60/40 allocation, they're now not only dealing with 8%+ CPI and $5/gallon at the pump, but also the biggest shock to their retirement portfolios since the worst stretches of the Financial Crisis. Not even during the Dot Com Crash of the early 2000s did we see a six-month decline of this magnitude in 60/40 portfolios.

Of course, investor sentiment remains historically bearish after such large declines, and we definitely aren't hearing anything positive from market commentators that had been bullish leading up to the peak six months ago. In terms of historical analysis, most of our work shows that if you have longer than a one-year time horizon, now is the time to be putting money to work rather than raising cash. Remember, the goal is to buy low and sell high, not buy high and sell low! There's a reason the phrase "buy when there's blood in the streets" came into existence. Historically, it has worked. While there isn't an official "blood in the streets" indicator (maybe we'll make one!), we think the second-worst period for 60/40 in 50+ years at least comes close to qualifying.

Have questions? Ask me. I can help.

  • Created on .

A Few Items to Share

Now that we’ve hit the ground running in the third quarter I wanted to share a few different items with you. First are a couple of surprising stories I read over the weekend. And second is some quick commentary and a chart that will hopefully be reassuring amid all the talk of recession lately.

Now, I’m closer to this sort of information than the average person and I also tend to focus on risk more, but this first article is a reminder of how bad things can get when new financial products come to market faster than the regulators can pay attention.

I’m talking about the rapid rise and dramatic fall of so-called high-yield savings accounts built on the back of digital assets like Bitcoin, Ethereum, and smaller cryptocurrencies. These were all the rage when Bitcoin, for example, was riding high. But as prices fell precipitously so did the shaky foundations that many of these companies were built on.

In this case it’s the bankruptcy filing last week of Voyager, a company that wooed depositors with high interest rates on crypto deposits that could be easily converted into dollars and spent via a debit card. The company’s marketing implied safety and security while being anything but behind closed doors. Ultimately while maybe not a total sham, at a very charitable minimum the company seems to have made light of the variety of risks to depositor’s assets. This led regular people to deposit more and more of their savings, thinking that they were doing the right and responsible thing and, oh yeah, that they were being well-compensated for it along the way.

Did these folks never play the game of musical chairs? Did they not do a basic sniff test to gauge how solid it was to receive high yields on deposits (Voyager touted up to 9% - other companies into the teens) when real banks were offering less than 1%? Nothing is free in this world and financial institutions aren’t in business to give money away. Higher-than-average yields should always smell risky – there has never been a time when this wasn’t true.

There’s absolutely a place for risk in your financial life. We willingly take it with stocks and bonds every day. But we also consciously limit our risk by having a clear line drawn between money that’s investible for long-term growth and what we need to keep safe for shorter-term needs. Blur these lines too much and you’re bound to have problems when markets turn.

I don’t entirely fault the individual depositors referenced in this story. They were enabled by being sold a bill of goods by Voyager and an emerging industry that, I believe, is less concerned with the future of digital assets as a great democratizer of finance than making millions off the backs of unsuspecting and naïve consumers. The game is as old as time. It’s just shocking how easy it still is.

https://www.vice.com/en/article/g5vgqw/its-ruined-me-voyager-customers-fear-life-savings-gone-after-crypto-firms-bankruptcy

The next article has to do with the average car payment in the US rising to $712 per month. Maybe I’ve been living under a rock but, wow, that seems like a lot of money. And that’s just the average, implying that lots of folks are driving around with a car payment much higher than that. This was originally reported by NPR based on data from Moody’s Analytics.

According to Moody’s, it takes about 41 weeks of a typical person’s income to buy a new vehicle these days, up 14% from a year ago. Supply-chains and inflation are blamed, as is a slew of gadgets and upgrades bringing the average sale price to over $47,000. This seems unsustainable, at least for the typical person, but data from other sources doesn’t show a big uptick in late car payments yet. So long as the economy holds out people should be able to afford these payments.

https://www.npr.org/2022/07/02/1109105779/monthly-car-payments-record-700

Along those lines, here’s a couple of items from JPMorgan regarding the economy. Ultimately, it’s a mixed bag in terms of positive readings versus others that appear to be rolling over. But a big indicator is the job market, which appears healthy. It’s tough to be in a recession when that’s the case.

Here are some recent thoughts from JPMorgan on the “Are we in a recession?” question:

[…] Recently, recession fears have bubbled to the surface, as the Federal Reserve Bank of Atlanta’s “nowcast” of economic growth now points to a contraction [in this quarter]. This tracker – appropriately named GDPNow – […] suggests that 2Q22 real GDP will decline 2.1% due to a significant slowdown in consumer spending and a contraction in private investment.

[…] Looking ahead, we recognize that recession risk has risen. That said, it seems premature to make a call that we are already in recession today. To start, the labor market remains robust, with job openings still elevated, wage growth solid, and payroll employment growing at a rapid clip. Furthermore, many of the pain points in the economy have begun to correct themselves – commodity prices have come off the boil, inflation looks to have peaked, and market expectations are now for the Federal Reserve to begin cutting rates in 2023.

For investors, it is important to remember that markets are forward looking. Put differently, the equity market tends to peak before a recession starts and trough before the economic data begins to improve. While risks to the outlook have risen, valuations have become more favorable and sentiment is beginning to look washed out; this is not an attempt to call the bottom, but rather a recognition that the outlook for risk assets is more favorable today than was the case at the start of the year.

Have questions? Ask me. I can help.

  • Created on .

A Little Bit of Rebalancing

With all the recent market volatility I thought it would be interesting to lift the curtain a bit on one aspect of how I manage client portfolios, my rebalancing process. This might provide some insight and perhaps some reassurance if I’m managing your investments, or perhaps a bit of help if you’re managing things on your own.

First let me say that setting up and managing a portfolio of investments entails both art and science. There are also tons of details to get your arms around and most are in constant flux. I have to think about the markets, the outlook, taxes, brokerage firm mechanics and expenses and, above all, what the client needs. None of this guarantees success. Instead, portfolio management is fundamentally an exercise in trying to control what can be controlled regardless of what the markets throw at us.

So hopefully without getting too deep into the weeds, let’s jump right in.

Everything I do for my clients is custom and based on factors such as:

General needs – Maybe the client needs retirement income or is trying to accumulate money for retirement. Sometimes, perhaps ironically, it’s both at the same time with the added kicker of wanting to preserve as much money as possible for beneficiaries.

Tax situation – I’ll often build portfolios around concentrated positions that would create a large tax bill if sold arbitrarily. It’s also common that clients need their income to be as tax-efficient as possible. Both requirements end up complicating portfolio construction and put added emphasis on so-called asset location. This is especially true when clients have IRAs, Roth IRAs, non-retirement “brokerage” accounts, and maybe college accounts for their kids and grandkids too; each are subject to different tax rules and should be invested accordingly.

Personal preferences – Sometimes clients want to emphasize (or deemphasize) certain industries or even particular companies in their portfolios. The process for getting this done has evolved a lot in the nearly 20 years I’ve been doing this work and software helps a great deal.

Risk tolerance and capacity – Each of us has our own tolerance for investment risk but we should also understand our capacity for taking it on. The first is psychological while the second is, or at least ought to be, purely financial. Sometimes the two align but often they don’t. The result tends to be a sometimes-tenuous balance between taking enough risk to achieve the returns I know the client needs but not so much risk that I set the client up for failure in a volatile market. And it doesn’t always work.

I have a variety of tech at my disposal to automate the investing process and lots of others in my industry simply farm this work out to third parties. “Freemium” and ultra-low-cost cookie-cutter services are clicks away. But opportunities can get lost in the rush to make everything easier. While there certainly are some similarities between Clients A, B, and C, the differing details of each person’s situation are plentiful and meaningful enough that investment models, and the work I do in general, should be custom.

A client’s model is essentially a list of investments chosen by me to a fill a specific need within the portfolio. Each investment has its own weighting and I put this into fancy software to analyze the model and tweak things until it’s just right. I make decisions about investment income, expenses, exposure to domestic versus foreign stocks, short- versus medium-term bonds, and so forth. There’s a laundry list of analytical stuff that I won’t bore you with here.

Once the model is set up I send it to my rebalancing software. From there I don’t just push a button and let an algorithm buy and sell on a client’s behalf. Instead, I set and monitor target ranges around each investment in a client’s account. For example, let’s say I want 12% of a portfolio invested in the Vanguard High Dividend Yield ETF, ticker symbol VYM. The software flags me when the target weighting has dropped by 10%, 15%, 20%, or whatever I want. If the position has grown too much the software recommends selling some to bring it back within range. And since growth in one area naturally means loss in another, the software also points out investments that are at the low end of their target range. This is rebalancing at the micro-level whereas most people go macro by just looking at their overall exposure to stocks and bonds assuming they rebalance at all.

Each week I go through all the portfolios I manage but during volatile times like these it can be daily. This higher frequency is mostly to monitor things as closely as possible and doesn’t mean that I buy and sell every day. In fact, it’s often about what I don’t do, what I don’t buy and sell, that can make a positive difference for clients. That’s one reason why the thresholds are ranges and not 0% - portfolios should be allowed to move around with the markets so long as the range is controlled.

As I monitor the rebalancing process I’m also scrutinizing each investment to ensure it’s still high quality, low cost, and continues to fit within the portfolio. Since I’m unconstrained in what I can buy for clients I’ll swap an investment out if needs be, or I can move things around for tax-loss harvesting.

Here’s part of a screen showing an actual model from yesterday. The investment ticker symbols are on the left followed by my target weightings, actual (current) weights, and variance. We see the software’s recommendations in the yellow column and on the right we see what the portfolio would look like if I said yes to everything. That’s the big picture. Then I consider the client’s situation.

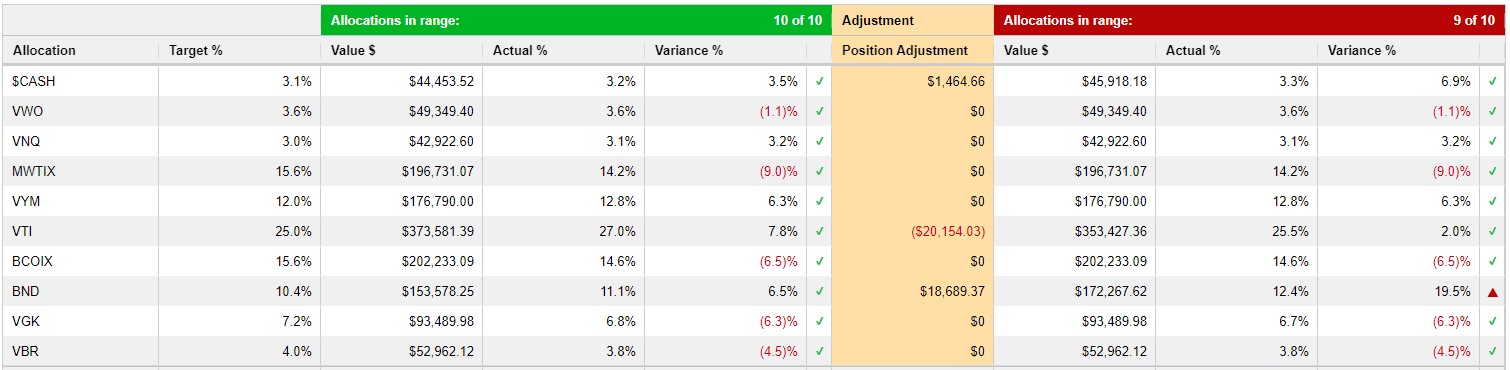
This client has ample cash in their portfolio (and in their bank account) and the 3.5% variance is fine, so we’ll leave that alone. No other variances are beyond even 10%, so we’re good there for now. However, lately I’ve been buying Vanguard Total Stock Market, ticker symbol VTI, and the client’s exposure has inched up with the market. Should it continue to climb I’ll be looking to trim it back and give sale proceeds to bonds via tickers MWTIX, BCOIX, potentially to foreign stocks via VGK, or all three. You may notice how the software is recommending I go up to 19.5% variance on BND, another bond fund. That’s because I put a cap on MWTIX and told the software to recommend BND instead. There are all sorts of fun customizations like that.

All this helps a client’s bottom line over time, and I could go on but let’s leave it there for today. Stocks finally had a good run last week and we saw some decent follow through yesterday. Even though markets finished in the red, it was by a small fraction and, given all the recent volatility, I’ll take it.

Have questions? Ask me. I can help.

  • Created on .

Overexposure

I don’t know about you but I’m feeling very exposed lately. Exposed to what, exactly? Everything. Inflation, interest rates, the stock and bond markets, our dysfunctional politics, geopolitics, cultural and demographic shifts, the growing risk of this or that. Each would make for interesting theoretical discussions as a one-off or even a pair. But now they’ve all seemed to coalesce into something much larger, a problem greater than the sum of its parts.

In a way this reminds me of Warren Buffet’s quote about only seeing who’s been swimming naked when the tide has gone out. He was probably thinking about how good times can allow poorly run companies to continue for a while until markets turn and investors start caring about risk again. The quote also works well for personal finance if you put yourself in the company’s role. Are we managing our own situation like Enron, or are we really in much better shape and just feeling extra anxious because of tumultuous headlines and prices at the pump?

How we feel about this is primarily a psychological issue and that’s not where my expertise is. That said, I’m human and am willing to admit to feeling the weight and needing a reminder that I’m okay, even though so much around me isn’t. Funny, that sounds just like what we were talking about last week, right?

Since my corner of the world is all about personal finance, here are some questions to assess your level of exposure to the financial side of all this. Hopefully the end result is at least a little relief from the stressful times we’re living through.

Is your income secure? This question alone can lead to lots of anxiety, but think about it: Is your job pretty steady? If you own a business, how’s your cashflow? If you’re retired and much of your income is from Social Security and pensions, are the checks clearing? All kidding aside, consistent income is the bedrock of your household’s financial well-being and leads into these next questions.

Do you have cash on hand to cover at least six months of household expenses? While there’s no one right amount for the size of your emergency fund, six months is a good target. This should provide time to pivot if you lose your job or have a large emergency expense. But remember this is based on your typical spending and doesn’t include buying big-ticket items in the next year or so. If those expenses are on the horizon you should add that money to your emergency fund so as not to draw it down too low. A much smaller or nonexistent emergency fund leaves you exposed to a number of risks beyond your control.

Do you have enough cash or short-term assets beyond your emergency fund to cover larger expenses expected sometime in the next 3-5 years? Maybe this is tuition money, a car purchase, buying a house, or even starting your own business. Whatever the expense, having those dollars allocated to no-risk or low-risk assets such as CDs or shorter-term bonds eliminates your exposure to stock market volatility for those expenses – five years or less is no place for stock investing. And interest rates are higher now, so this money can actually earn something in the meantime.

Where you hold this money is important as well. It should be easily accessible without large fees or other restrictions and can be at your bank or credit union, or an investment account somewhere. Ideally, short-term spending shouldn’t come from your retirement account unless you’re already retired. Sometimes life happens and you need to withdraw retirement money early because, well, you need it and that’s where it is. I had to raid my 401k when I started this business back in 2014, so I get it, just be extremely careful about the details.

Are your longer-term investments managed appropriately? I don’t mean are they making money right now, because your investments are likely down quite a bit from a year ago. Instead, I’m referring to quality, proportion, and cost of the investments in your portfolio. If you own good stuff in the right proportions and the values are all over the place due to the world today the best thing to do is hold on. Buy more if you’re still accumulating. Hunker down if you’re retired.

I’m rebalancing client portfolios and harvesting losses where appropriate. This is important and helps performance in the longer-term, but there’s little else to do in the meantime. You should be able to weather this just fine if you have adequate assets to cover the short-term categories mentioned above. If not, you’re overly exposed to market risk and should either cut your losses and rebuild from the ground up or tough it out and hope it out, so to speak.

Are your debts manageable and sustainable? Ideally, these days your debts should cost 4% or less on a fixed rate. Student loan debt has lots of twists and turns to it, but payments should be manageable within your current budget. If your debt is more expensive or you’re carrying credit card balances, this is “bad debt” that you’ll want to prioritize paying off based on rate and terms.

If you can answer yes to each of these questions it means you’re probably less, or even much less, exposed to today’s craziness than you think. You can ride out market volatility because you won’t have to sell stocks to cover near-term expenses. You can let your portfolio and your humble financial planner do their work. In other words, you’re wearing a wetsuit versus swimming naked.

Lastly, I suggest keeping a record of your basic financial information that you look at regularly. Mine is a super-basic Excel spreadsheet that I’ve used for years and manually update every workday. While I love automation and have access to lots of fancy tech in this area, I like the manual process for this because I have to log into accounts and personally fill in the cells, keeping me closer to the information. It doesn’t take long either, maybe 10 minutes or less most days.

Updating my spreadsheet reminds me of what I have at least some control over, like our personal income, spending, savings, and overall structure. It also helps me better understand my actual versus perceived exposure to everything going on out there in the world. I highly recommend you do something like this, whatever format you choose, and regardless of how much money you have. We all have to start somewhere, right?

Have questions? Ask me. I can help.

  • Created on .

Contact

  • Phone:
    (707) 800-6050
  • E-Mail:
    This email address is being protected from spambots. You need JavaScript enabled to view it.
  • Let's Begin:

Ridgeview Financial Planning is a California registered investment advisor. Disclaimer | Privacy Policy | ADV
Copyright © Ridgeview Financial Planning | Powered by AdvisorFlex