As I mentioned last week, negative indicators have been building out there but each seems matched by something positive, creating a familiar tug of war that tends to show up at market cycle inflection points. This will be on full display in the coming days as the Fed is expected to start lowering its interest rate benchmark on Wednesday. While this sounds good on the surface because it’s what investors expect and juices up the parts of the economy and markets, it creates negative ramifications elsewhere – it’s just the way it works.
This week I’m leaning on a couple of pieces I received yesterday from JPMorgan. One sheds light on the difficult spot the Fed is in with this rate decision while the other talks about four potential directions for the markets from here.
The bottom line with all this, also like I mentioned last week, is that it’s a good time to rebalance your portfolio.
The primary US stock benchmark, the S&P 500, has been “overbought” since May. Overbought is a technical term indicating the current price of the S&P 500 is at least one standard deviation above its 50-day moving average. That’s spread across the 500 stocks in the index and while some of those stocks are very expensive, many more are fairly valued or even undervalued. That internal mix is a positive spin on what’s otherwise a negative indicator, and it could help prices stay higher for longer. After all, the next three months are usually some of the best of the year for stock performance.
Remember that rebalancing doesn’t mean selling all of your stocks and waiting to get back in later. You’re trimming from the winners and adding to underperformers. This means you’re still invested in stocks when rebalancing, just not quite as much as before, so you’ll benefit if stocks continue higher from here. What you’re doing is incrementally reducing risk.
Okay, on to the two pieces from JPMorgan…
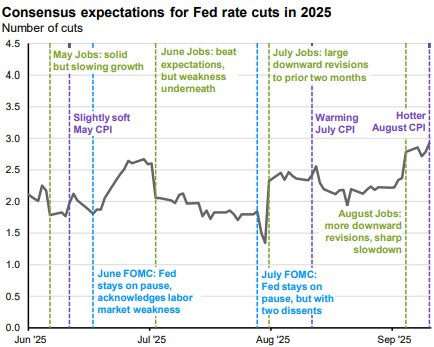
To cut or not to cut? Markets have been weighing each economic data print on the Fed’s balance of risks. As this week’s chart shows, mixed reports on jobs and inflation have sent the scale tipping back and forth, underscoring the difficulty of the Fed’s position.
After several months of stronger than expected payroll gains, July’s jobs report showed definitively that hiring momentum had slowed. Last Friday’s August report told a similar story. The U.S. economy added just 22k jobs last month, well below expectations of 75k, and 27k jobs were removed from the past two months. But this weaker labor market hasn’t translated to material disinflation. Immigration policies are contracting the labor supply, putting upward pressure on wage growth, despite the slowdown in hiring. August’s 4.3% unemployment rate is the highest since the pandemic, but well below the 50-year average of 6.1%. On the other hand, Thursday’s CPI report showed core inflation of 3.1%, well above the Fed’s 2% target, and tariffs and OBBBA stimulus could spark an acceleration. So, while the last two jobs reports green light the Fed to cut next week, the margin of error is razor thin.
Stock and bond markets might cheer the decision initially, but the longer-term investing implications aren’t so clear. Rather than boosting demand, rate cuts can destroy it as households lose interest income much faster than the cost of debt comes down. Longer-term yields may actually rise, as a cut [this] week could fuel concerns about inflation and Fed independence. Real assets like infrastructure and diversifying globally could help investors with the tough task of building portfolios resilient to both a growth slowdown and an inflation speedup.
There are four market outcomes: higher or lower equities in combination with higher or lower yields.
While peak uncertainty has subsided, many outstanding questions for investors remain: How much will the Fed cut rates? Will tariffs boost inflation? Is labor market weakness a headwind or head-fake? Forecasting definitive answers to these questions may be challenging – let alone how these dynamics interact – but devising a spectrum of scenarios to assess how markets could be impacted can help investors position portfolios. We’ve done just that in partnership with our Portfolio Insights team.
Principally, there are four market outcomes: higher or lower equities in combination with higher or lower yields. With that as a framework, here are four potential scenarios that could play out in markets over the next 6-12 months:
- Full steam ahead: Accelerating growth (stocks up, yields up) - Weakness in the labor market proves to be a head-fake, unemployment remains low, and tariff impacts prove to be manageable. With peak uncertainty behind us, consumption picks up and AI capex balloons, further aided by tax cuts enacted. The Fed delays rate cuts. Stocks, yields, and the U.S. dollar rise. Opportunities: Large cap, small cap, high yield | Risks: Core bonds
- Steady as she grows: Slow and stable growth (stocks up, yields down) - The U.S. economy is growing but slowing. Corporations pick up most of the tab on tariffs, which weighs on profits, but revenues are solid given the consumer absorbs less of the cost and inflation remains relatively contained. Markets drift higher and yields drift lower. The Fed cuts modestly and the U.S. dollar falls further. Opportunities: Large cap, international stocks, core bonds | Risks: Small cap, U.S. dollar
- Rough waters: Recession (stocks down, yields down) - Cost pressures and lingering uncertainty prompt companies to pull back on hiring and capex. Labor market weakness accelerates, and unemployment rises. Consumers pull back on spending. Profits decline. The U.S. economy enters recession. Stocks tumble, but bonds protect. The Fed cuts meaningfully to support the economy. The U.S. dollar rises as investors seek refuge. Opportunities: Core bonds, U.S. dollar | Risks: Domestic (large and small) and international stocks, high yield
- Inflation unanchored: Stagflation (stocks down, yields up) - Inflation reaccelerates due to tariffs and rising service costs. The labor market weakens, and consumption slows. Growth sputters but avoids recession. The Fed is forced to reverse course and hike rates. This U-turn in monetary policy causes stocks to stumble and the dollar to fall, while yields spike above 5%. Opportunities: Short-term fixed income, international stocks | Risks: Large cap, small cap, core bonds, U.S. dollar
Have questions? Ask us. We can help.
- Created on .